top of page
VGS clients, such as:
Client Account Managers
Risk Analysts
Technical Administrators
Operation & Support teams
As the Senior Product Designer, I led a user-centered design approach grounded in close collaboration with stakeholders, aligning business goals with user needs. I translated complex credential data requirements into intuitive UI designs, using wireframes, prototypes, and stakeholder feedback to ensure clarity, scalability, and usability across the dashboard experience.
Source Sans Pro Regular
Source Sans Pro Bold
Averta Regular
Averta Bold
Typography
We chose Source Sans Pro and Averta to balance clarity, professionalism, and modernity in the CMP Dashboard. Source Sans Pro offers high legibility and a neutral tone, making it ideal for data-heavy content and detailed views. Averta adds a clean, approachable feel with its geometric shapes, creating a clear visual hierarchy and reinforcing the dashboard’s structured, user-friendly design.
Source Sans Pro
Averta
Colors
Primary Brand Color
#A300CC
Secondary Color
#FDF5FF
Accent Color
#F7F9FC
Text Color
#343434
Surface Color
#FFFFFF
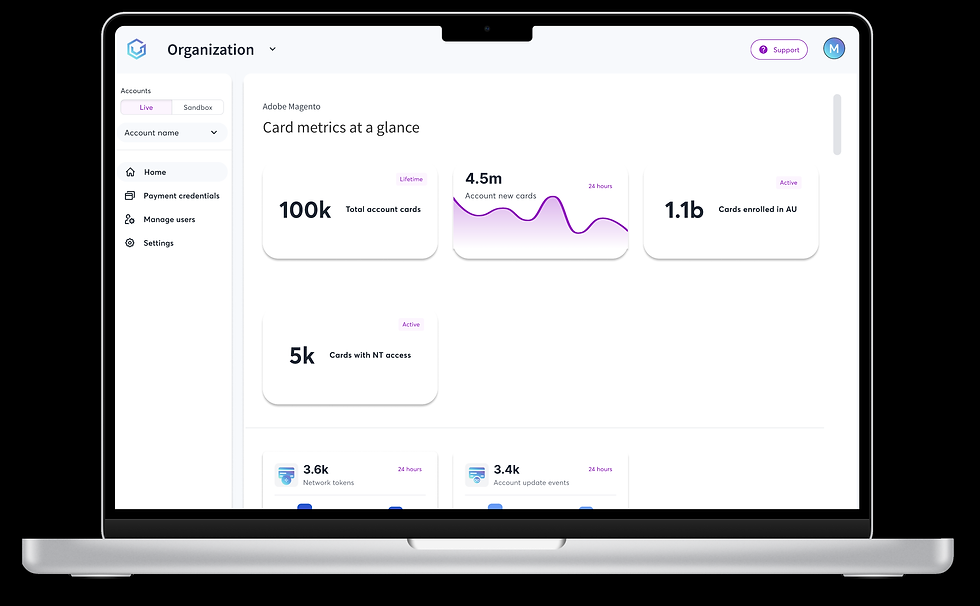
A scalable, self-serve dashboard to help VGS clients manage, monitor, and make sense of complex credential data across services
CMP Dashboard
The CMP Dashboard provides a centralized, intuitive interface that enables clients to view, filter, and manage their credential data across VGS services—improving visibility, control, and operational efficiency.
Clients had no centralized, user-friendly way to view, manage, or understand their credential data across VGS services, resulting in limited visibility, inefficiencies, and reliance on support teams.
User Personas
Sarah Williams

Age
38
Experience
10+ years in operations, managing teams and overseeing complex data workflows in fintech
Occupation
Senior operations manager
Location
Columbus, Ohio
Goals
Ensure seamless management and oversight of card and credential data across various systems and accounts within her organization.
Pain points
Difficulty in managing a large number of card accounts across multiple services and products.
Lack of visibility into real-time data or performance metrics on card transactions.
High volume of support inquiries due to unclear or inaccessible data.
Needs
A user-friendly dashboard that consolidates all card data in one view.
Real-time tracking of card performance metrics (active/inactive cards, card updates).
Tools for managing card data (updates, tokenization, and expiration dates).
Easy-to-navigate interface for managing user roles and access.
John Anderson

Age
29
Experience
7 years in client relations and sales within the tech industry
Occupation
Account executive
Location
Austin, Texas
Goals
Facilitate the onboarding of new clients, ensuring they are able to manage card data and services effectively.
Pain points
Clients often struggle to understand the nuances of card data.
Lack of centralized visibility for card performance or transaction anomalies.
Difficulty in resolving issues quickly without real-time insight into client card data.
Needs
A simple, clear interface that allows quick access to card data for troubleshooting.
Real-time metrics on card status, usage, and performance.
The ability to toggle between test and live environments (Sandbox and Production).
Tools for managing clients' card data, including updates, account information, and status changes.

Filter Credentials by Service Status
Edit Personal Information

User can edit their personal information
Profile
Tags tell the user what time frame the data is being pulled from
Tags
Dropdown
Side navigation
Graphs
Metric tiles
This displays relevant account data to the user
This allows users to switch between organizatrions
Allows user to navigate between pages
Graphs display relevant trend data to the user

This CTA allows the user to invite other users to their organization by email
Invite user
Table allows users to view other users in their organization
Manage users table
Search bar
User can search through other users by name/email or filter by role

Accordion collapses information for the user to expand as needed
Accordion
Displays to the user that NT/AU is active
Active tag
User can toggle between live and sandbox accounts
Live/Sandbox toggle
Thank you for your time :)
Please feel free to contact me with questions, concerns, or advice.
To tackle the complexity of the CMP Dashboard, we applied a design thinking approach to ensure we were solving the right problems for the right users. This began with empathizing with client pain points through stakeholder interviews and reviewing existing client interviews to uncover recurring themes around visibility and data fragmentation. I then worked with product and engineering to define clear user needs—such as the ability to search, filter, and drill into credential-level details.
During the ideation phase, I explored multiple layouts and interaction models, balancing technical feasibility with usability.
Define
User Persona
User Jouney Map
Goal Statement
Ideate
Brainstorming
Service Blueprint
User Flow
Design
Low-Fidelity Wireframes
High-Fidelity Wireframes
Prototype
bottom of page